Your 25% win rate is lying to you.
Pipeline & Deal Velocity
Who is it for?
For revenue leaders and sellers measuring performance through stage conversion and win rate.
When to use?
Use when headline win rates look acceptable but mask bad qualification, bad segmentation, or false pipeline health.
7 Dec 2025
Win rate is one of the most misread metrics in sales. This piece explains how a seemingly decent number can hide deeper commercial problems.
Most B2B sales forecasts are massively overoptimistic because they confuse two different metrics: win-rate and win-rate-within-quarter.
If 25% of your closed deals are wins, but 60% of your pipeline pushes to next quarter, what is your win rate for deals in this quarter? It's 10%. Ie. you won 25% of the 40% that actually closed in the quarter, and 25% of 40% is 10%.
I agree the % of % can be confusing. But they are the root of the problem: you forecast $250k from your $1m pipeline, but you’re actually heading for $100k.
If you do this consistently, you're either getting fired or your CEO is missing board commitments. Or both
THE DEAL THAT BREAKS YOUR FORECAST
Imagine a $500k deal with close date December 31st. You're well-positioned - Champion and Economic Buyer are aligned - but there's tricky paperwork to navigate. Will it close this month or push to January?
90% chance you win it eventually
50% chance it happens this quarter
How do you forecast it?
At 90% in Q4 you're overstating Q4.
At 50% in Q4 and 90% in Q1, you're double-counting.
Most teams get this wrong. And it's not just one deal - it's dozens across your pipeline.
WHY THIS HAPPENS (THE MATH/S)
Let's get deeper into calc the I started this post with. Assume you enter the quarter with $1m in pipeline for that quarter. You know your historical close rate is 25% - meaning when deals close, you win one in four.
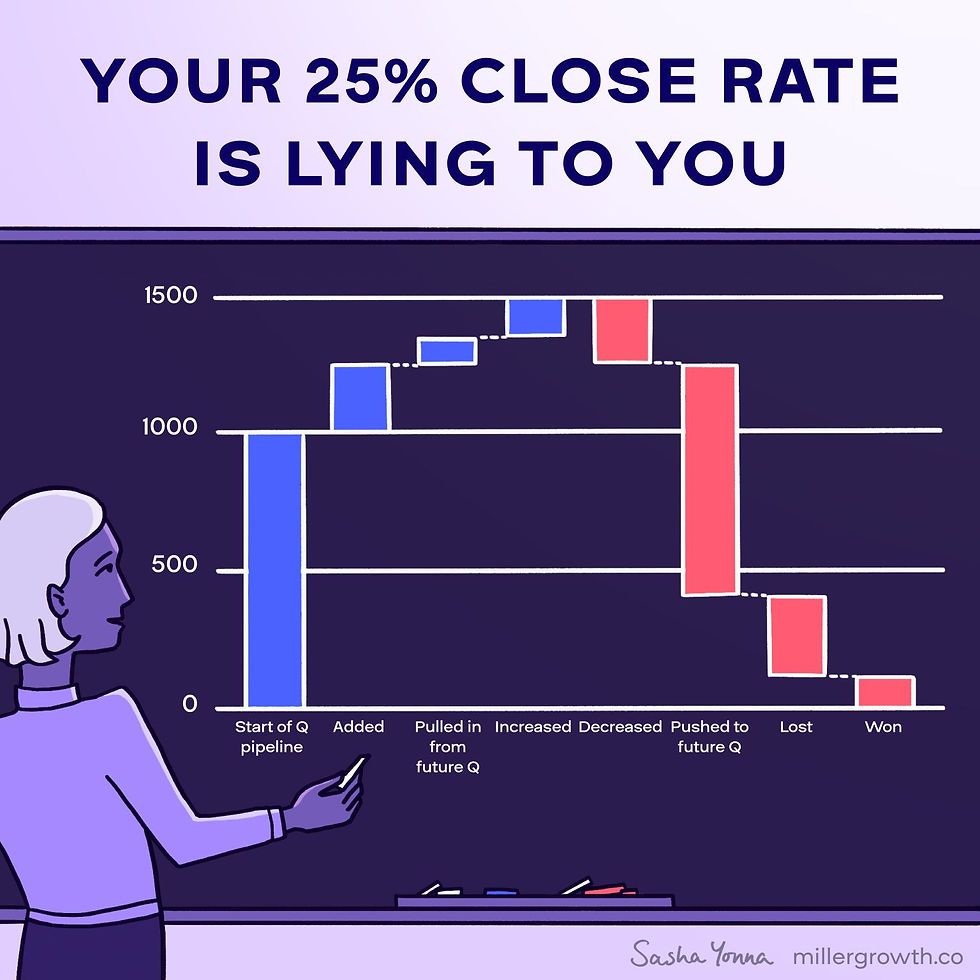
Traditional forecast: $1m × 25% = $250k
But look at what actually happens during the quarter:

The waterfall highlights the problem.
Only 40% of your start of quarter pipeline ($400k) actually closes this quarter
The other 60% ($600k) pushes to future quarters
Of the deals that close, you win 25%
Reality: $400k × 25% = $100k
Your forecast was 2.5x your actual result. Ouch.
Your close rate (25%) only applies to deals that actually close. Your win-rate-within-quarter is 10% - and that's what matters for forecasting.
Quick test: What percentage of your quarter-start pipeline typically pushes to next quarter? If you don’t know, find out. If you do know, are you using that info in your forecasting?
(I appreciate that I am brushing over a whole bunch of other details in that waterfall chart, for another time…)
HOW TO FIX IT
Get ruthlessly honest about close dates
Every optimistic close date magnifies this problem exponentially. If you don't have a detailed step-by-step plan for closure this quarter, move it out. The temporary discomfort of a light quarter is better than the permanent embarrassment of a blown forecast.
Be clear on how the probabilities work
The deal probability must reflect likelihood of winning by the close date, not eventually
For deals on the quarter boundary, choose one approach:
(A) Keep in-quarter with lower probability (the 50% approach)
(B) Move to next quarter with higher probability, plus add a "pull-in opportunity" line item to your current quarter forecast
For that $500k December 31st deal with paperwork risk:
Option A: Forecast at 50% ($250k) in Q4
Option B: Forecast at 90% ($450k) in Q1, plus add $250k "pull-in opportunity" line to Q4
Never forecast it at 90% in Q4.
Base probabilities on historical evidence, not gut feel
Track your actual win-rate-within-quarter by stage. Eg:
Discovery: 10% close this quarter, 90% push
Technical validation: 23% close this quarter, 77% push
Commercial proposal: 42% close this quarter, 58% push
Negotiation: 71% close this quarter, 29% push
These real percentages become your forecasting model. Multiply your pipeline by win-rate-within-quarter, not close rate.
And if the numbers above reflect your reality, you’ve almost certainly got the wrong close dates - those deals in Discovery and Technical validation should be in a future quarter, along with many of those in Commercial proposal.
THE BOTTOM LINE
Stop confusing "percentage of closed deals we win" with "percentage of pipeline that closes won this quarter."
If 60% of your pipeline habitually pushes to next quarter, you need to build that reality into every forecast.
Let me know if you would like to discuss how to improve your forecasting accuracy.
If this was useful, stay close to the thinking.
Get practical GTM insights and strategic breakdowns in your inbox. Weekly.
Related Posts

Pipeline & Deal Velocity
2026-05-06
Complex enterprise engagements that make the difference.
Proven product, real hospital deployments, strong supplier interest - and a CEO carrying every major commercial conversation alone. This is how MediShout moved from early traction to seven-figure ARR by fixing the commercial execution layer, not the product.
Pipeline & Deal Velocity
2026-04-19
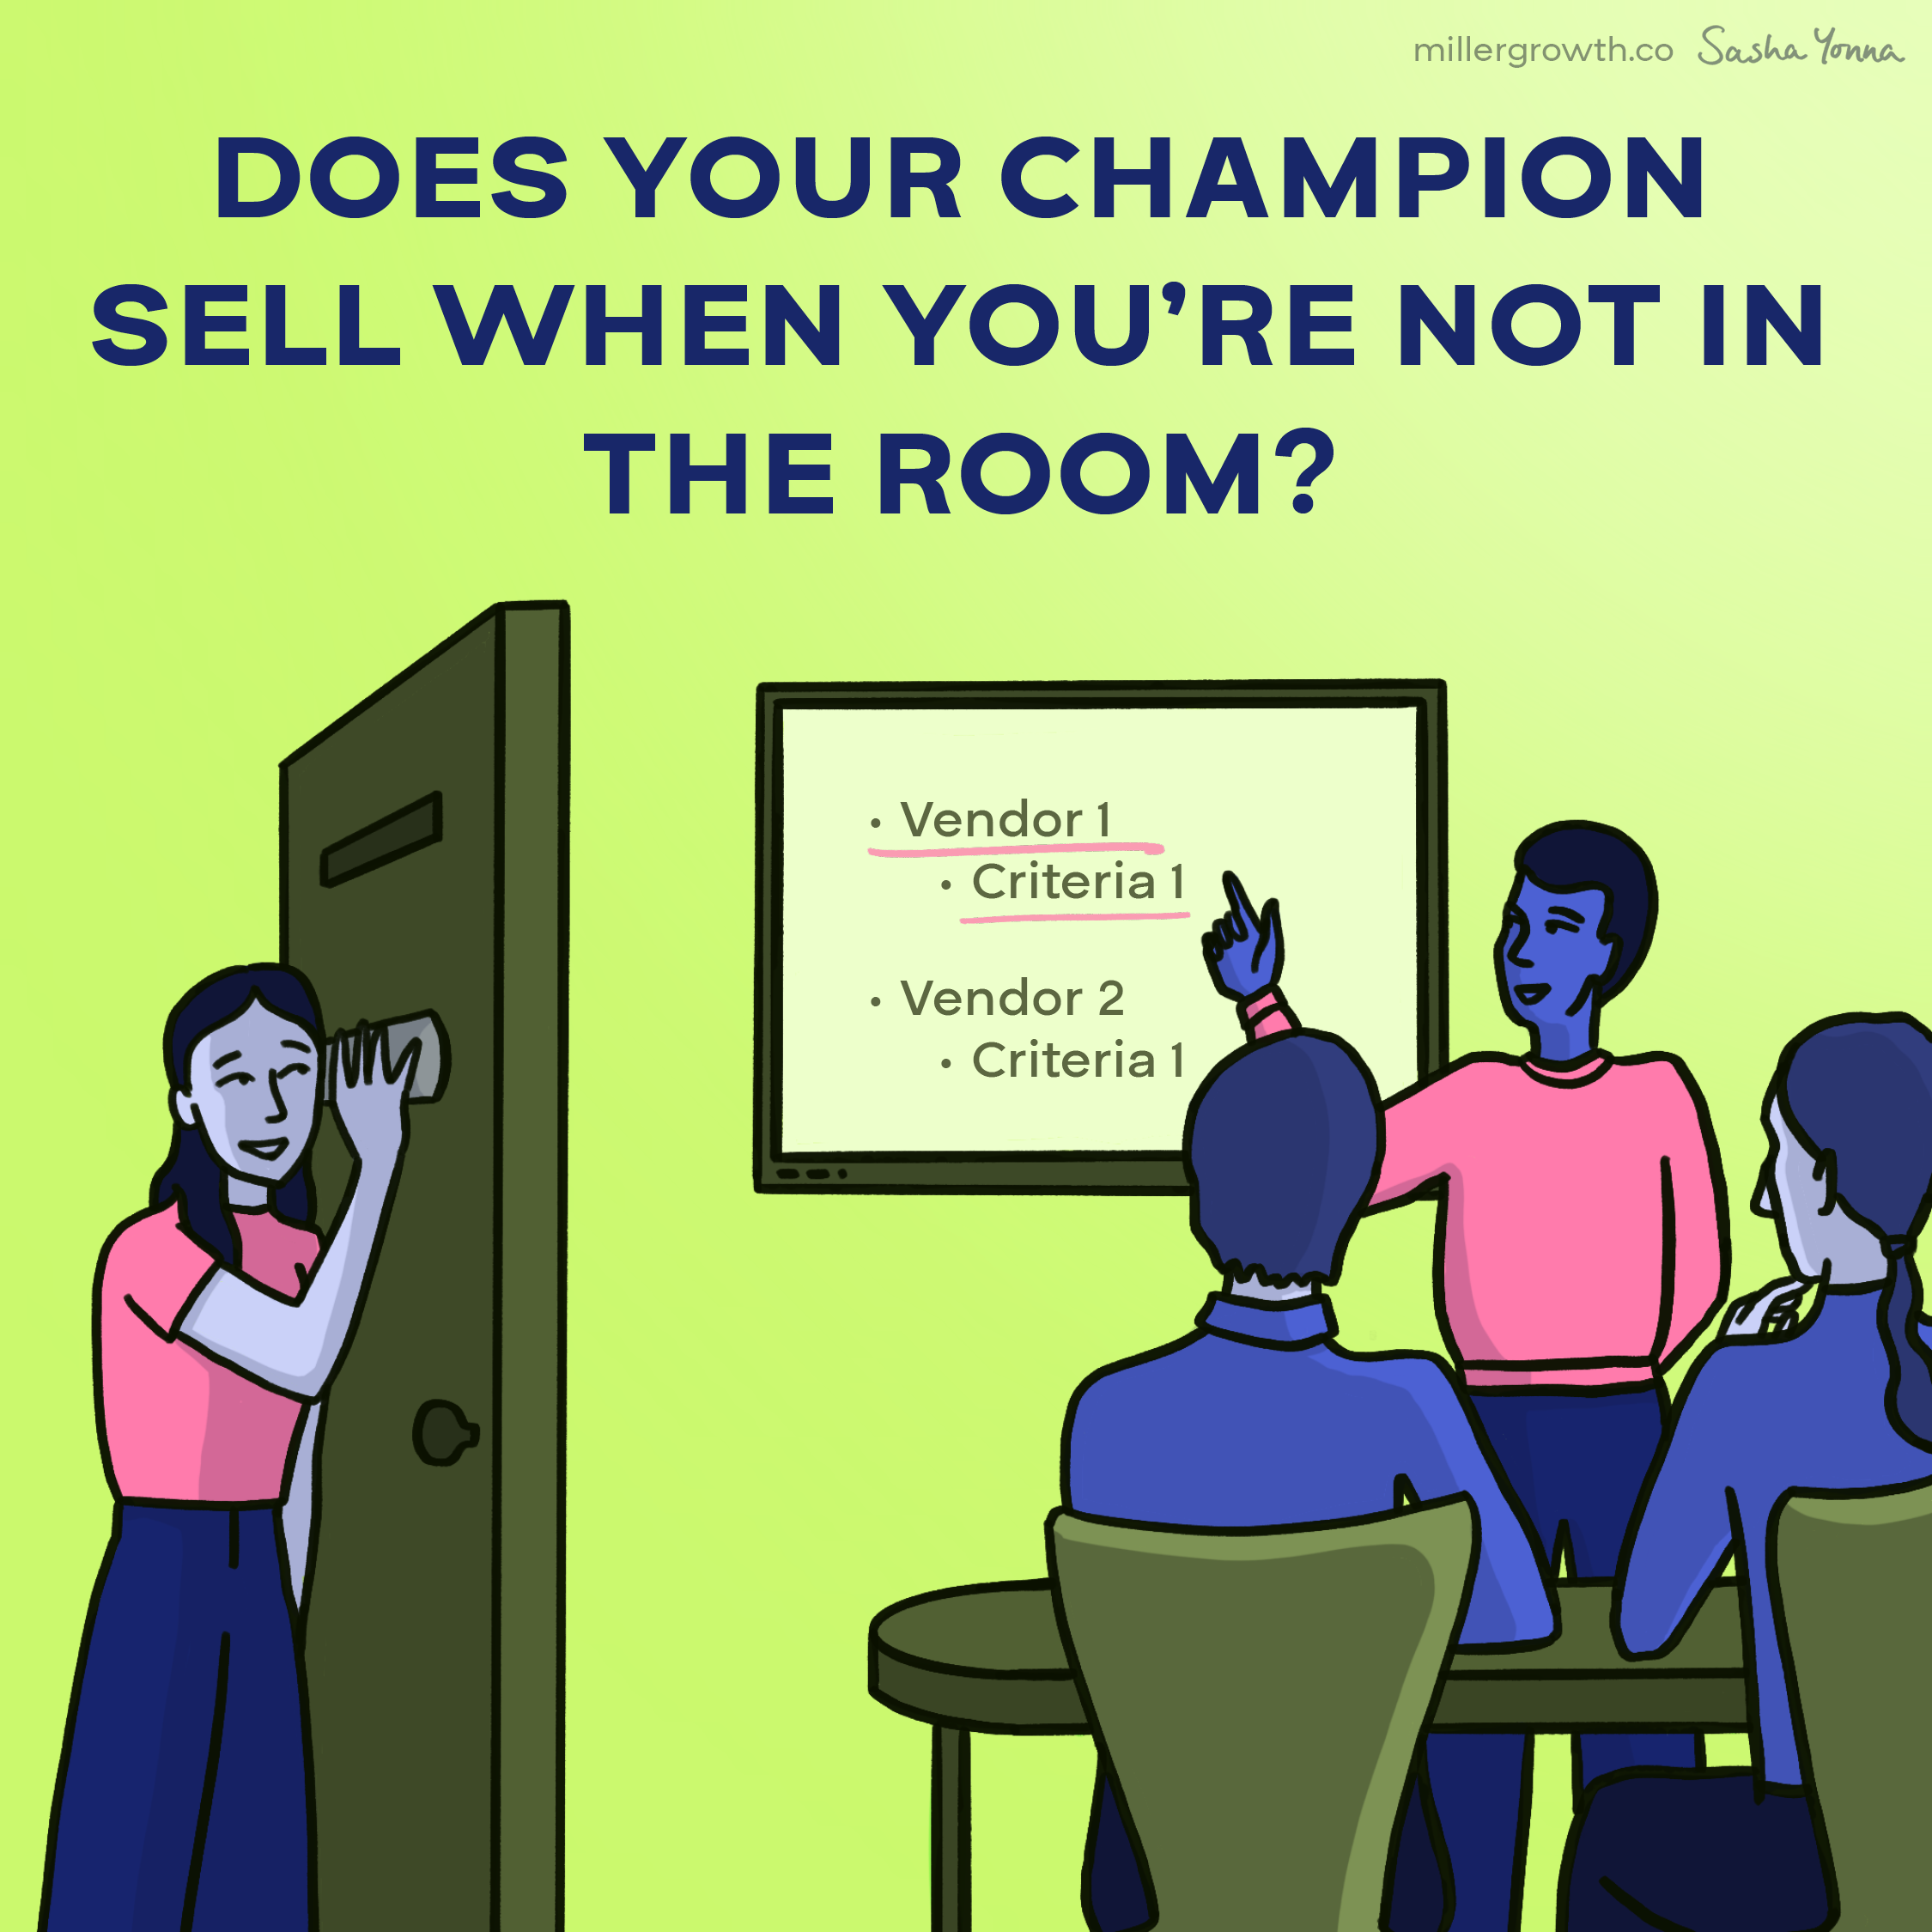
Selling when you're not in the room
In a complex sale, most of the conversations happen without you in the room. What determines the outcome is whether each stakeholder can recall and repeat a simple, specific reason why you're the right choice - and whether you've shaped what that reason is.

Relevant resources
Tools and insights for improving your revenue engine
Demo Training
Coach winning demos

Discovery Training
Qualify deeper, faster
AE Toolkit
Hire top performers
See more resources →